This post describes how to do clustering with ojAlgo. Support for clustering is new with v55.1.0. This version added basic implementations of k-means and greedy clustering, but in a very general and configurable way.
Paired with that there is a Point class corresponding to a (k-means) multidimensional data point, and using that, preconfigured clustering. Convert whatever data you have to a List<Point> and then call Point.cluster(points), and it’ll do its magic.
The example below demonstrates how to do this using a case Mall Customer Segmentation Data from Kaggle. The given task is broadly to understand the customer base so that marketing can be done effectively. If you want to execute the example code, you have to download the customer data file. The csv file containing the customer data looks like this:
CustomerID,Gender,Age,Annual Income (k$),Spending Score (1-100)
1,Male,19,15,39
2,Male,21,15,81
3,Female,20,16,6
4,Female,23,16,77
5,Female,31,17,40
6,Female,22,17,76
7,Female,35,18,6
8,Female,23,18,94
9,Male,64,19,3- The CustomerID is just a number identifying the individual customer – not of interest here.
- The Gender is Male or Female. There are 44% males and 56% females. When parsing the file we use boolean for this, where Male=true.
- Age is the age of the customer. The range of values is roughly 20-70
- Annual Income is stated in thousands of dollars (k$). The range is something like 25-125.
- Spending Score is not well defined, but somehow represents how “good” the customer is. The range is 0-100
Normally data needs to be preprocessed and standardised before it can be used with a clustering algorithm. In this case the data is directly usable (almost). What we want to control is the magnitude of the differences between the various measurements, also weighting in the relative importance of the different attributes.
- Annual Income and Spending Score both have a range of about 100 (difference between smallest and largest value) so they compare well.
- Age has a range of 50, but we’ll leave it like that assuming it’s slightly less important than Annual Income and Spending Score.
- Gender is categorical data. As such it is problematic to include in clustering. Either leave it out or give the categories some numerical value. Most people over at Kaggle seem to leave it out. Since there are only 2 categories (boolean, male/female) assigning a numerical value should work. In the example code below Male is given the value 10 and female 0. (Kind of equating a gender difference with 10 years age difference.)
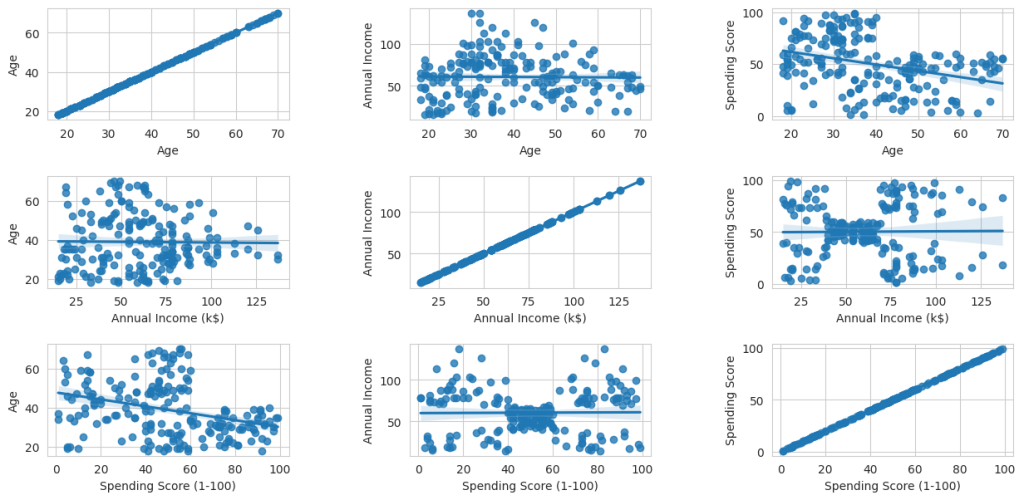
The image below (by Abdallah abuelftouh @ Kaggle) show ranges and correlations for the different parameters (except gender).

The charts show that there is an interesting “pattern” in the correlation between Annual Income and Spending Score, and also some inverse/negated correlation between Age and Spending Score.
Example Code
Console Output
class CustomerSegmentation
ojAlgo
2024-12-23

Number of customers: 200

Complete data set
============================================
Size: 200
Average: [4.4, 38.85, 60.56, 50.2]

Clusters (ordered by decreasing size)
============================================
Size: 76
Average: [3.9473684, 43.776318, 54.789474, 49.789474]

Size: 39
Average: [4.6153846, 32.692307, 86.53846, 82.128204]

Size: 38
Average: [5.263158, 40.394737, 87.0, 18.631578]

Size: 25
Average: [4.8, 24.48, 27.08, 76.12]

Size: 22
Average: [3.6363637, 46.409092, 26.818182, 20.09091]

Done: 78.260791ms
Interpretation
Complete data set
============================================
Size: 200
Average: [4.4, 38.85, 60.56, 50.2]
Over all there are 44% males, the average age is 38.85, average annual income 60.56k and average spending score 50.2.
Clusters (ordered by decreasing size)
============================================
Size: 76
Average: [3.9473684, 43.776318, 54.789474, 49.789474]
The largest cluster is fairly similar to the over all averages, but with a tendency towards being female, above average age and earning below average.
Size: 39
Average: [4.6153846, 32.692307, 86.53846, 82.128204]
Then there is a group of high earners / high spenders. Fairly young people in this group.
Size: 38
Average: [5.263158, 40.394737, 87.0, 18.631578]
The individuals in this group are also high earners, but clearly do not spend their money (at the Mall). This is also the only group where males are in a majority.
Size: 25
Average: [4.8, 24.48, 27.08, 76.12]
This is the opposite, some very young people that do not have money, but are big spenders anyway.
Size: 22
Average: [3.6363637, 46.409092, 26.818182, 20.09091]
And finally, low income low spending. These are generally older people. They’re also predominantly female
Further if we compare the 2 groups/clusters representing high income earners, we see that the average Age is significantly higher with the low Spending Score. The 2 groups/clusters representing low income earners show the same pattern, and here the age difference is huge.
